Pennsylvania National Wetlands Inventory ‐ Landscape Analysis
Description/Tasks:
A Level 1 landscape analysis for all mapped wetlands from the National Wetland Inventory (NWI) in the Commonwealth of Pennsylvania was performed. Landscape metric analysis, including landscape composition and four indicators of human activity -ratio core/total forest, road density, landscape development intensity index, and impervious surface- was quantified by integrating land cover and road network information (Table 1). All metric calculations computed at each wetland site (comprising >168,000 polygons) were automated using ArcGIS Model Builder® ESRI through iteration procedures (Figure 1).
Table 1. Primary Datasets (input data) used in the state-wide level 1 landscape assessment.
Input Layers used in the analysis:
| National Wetlands Inventory (PA) | 2014, 1:24,000 US Fish and Wildlife Service, National Wetlands Inventory (FWS/NWI) |
| NLCD Land Cover(PA) | 2011, 30-meter resolution Multi-resolution Land Cover Consortium, National Land Cover Database (MRLC/NLCD) |
| HUC-8 Watersheds (PA) | 2012, 1:24,000 United State Department of Agriculture, Natural Resource Conservation Service |
| Roads (PA) | 2009, TIGER/Lines Shapefiles (United States Census Bureau) (USDA/NRCS) |
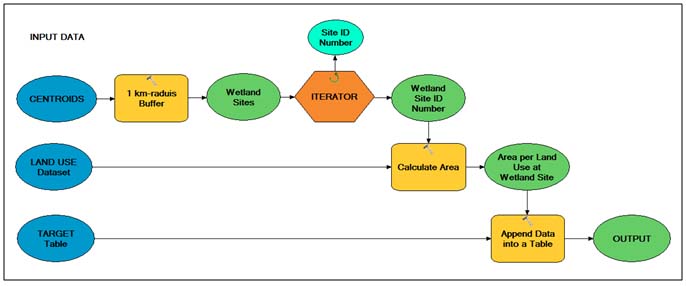
Figure 1. Simplified iteration process that quantifies land use area per wetland site and populates information into a table.
Proceedure: Brief description of the landscape metric analysis
Centroids (representative contained centers) were created for each wetland polygon within the Pennsylvania boundaries and wetland sites were defined as 1-km (r=1,000 m) radius circle areas around each centroid (Figure 2). Only centroids within the HUC-8 watershed boundaries in PA were selected for the analysis.
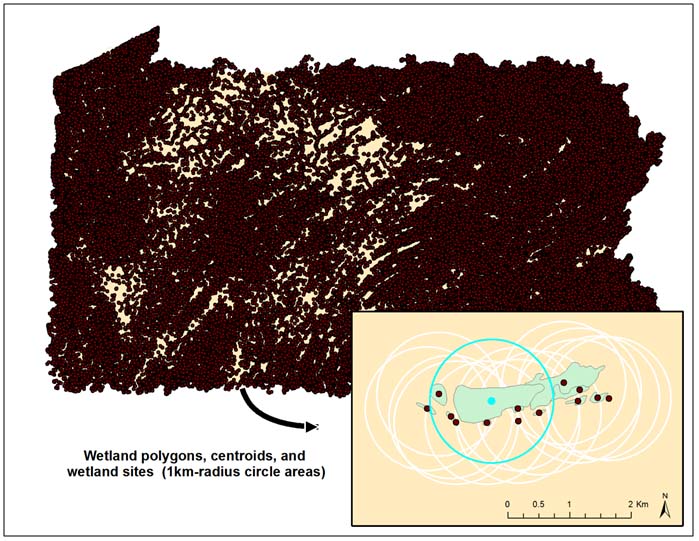
Figure 2. Example of centroids and wetaland sites (1-km radius landscape circles) generated to each NWI mapped wetland polygon within Pennsylvania boundaries.
All wetland sites were first characterized according to their landscape pattern. Landscape composition at each site was analyzed at class level, by quantifying characteristics of a set of patches of the same type (i.e., a land cover class) and extracting data from a previously computed land cover dataset. The derived land use/land cover dataset was the result of reclassifying the NLCD Land Cover raster into 11 classes: (1) water, (2) developed, open space, (3) developed, low intensity, (4) developed, medium intensity, (5) developed, high intensity, (6) barren, rock/clay/sand, (7) forest, (8) shrub, scrub, (9) pasture, hay, (10) cultivated crops, and (11) wetlands. Total area (ha) and percent (%) per land use class were then calculated.
Four indicators of human disturbance briefly described below were also calculated to all wetland sites:
1. Ratio Core/Total Forest Cover (Total Core Area Index)
Core and edge forest are components of forest fragmentation, the process of subdividing large tracts of forests into smaller ones. The method, resumed in this study, for identifying types of forest fragmentation was proposed by Vogt et al. (2007). It classifies forest land cover based on pixel-level patterns by specifying edge width. Accordingly, core included those areas or pixels of forest cover not affected by other land cover types (such as agriculture, pasture, urban development) while edge included forested areas affected or degraded by other land cover types. Edge forest was defined as the first 100 m distance from a disturbed edge. The ratio of percent core forest to percent total forest area at each wetland site was then estimated.
2. Landscape Development Intensity (LDI) Index
The LDI index for land use, defined as a human disturbance gradient units and employed as a landscape-scale assessment tool of wetland condition, was calculated by multiplying land use percentages with a weighted factor per land use as shown in the following equation (Brown and Vivas, 2005),
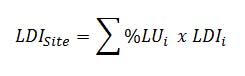
Where LDISite is the sum of all LDI scores at the wetland site, %LUi is percent of total area for land use i, and LDIi is the landscape development intensity coefficient for land use i.
3. Road Density Analysis
Road density (km/km2) was calculated as the total length of road segments within each wetland site area (1km-radius). The geoprocessing procedure included intersecting roads within the wetland site boundary and summing all road segments per wetland site.
4. Impervious Surface (%)
Impervious surface, refer to artificial features (e.g. pavement, rooftops) that prevent precipitation from infiltrating into the soil, was quantified as the impervious cover due to a combination of (1) land use and (2) roads density.
(1) U.S. Geological Survey developed an impervious surface estimate (NLCD Percent Developed Imperviousness) raster dataset based on the NLCD land cover data from year 2011. Average values of the NLCD developed imperviousness were quantified per land use class through spatial analysis.
(2) Impervious cover due to roads was created based on road attributes (i.e. information on paved and unpaved roads and estimated width for each category of roads) (USEPA, 2004).
Table 2. Estimated width and assigned percent impervious for each type of road.
| A1 | Primary Highway with Limited Access | 35 / 10.67 | 100 % |
| A2 | Primary Road Without Limited Access | 35 / 10.67 | 100 % |
| A3 | Secondary and Connecting Road |
26 / 7.92 | 100 % |
| A4 | Local, Neighborhood, and Rural Road | 16 / 4.88 | 60 % |
| A5 | Vehicular Trail | 12 / 3.66 | 0 % |
| A6 | Road with Special Characteristics | 12 / 3.66 | 0 % |
| A7 | Road as Other Thoroughfare | 12 / 3.66 | 0 % |
Paved roads were subtracted from the urban impervious land use category to avoid double counting. The total proportion of impervious surface corresponded to the sum of total impervious due to land use and total impervious due to roads.
References
Brown, M.T. and Vivas, M.B, 2005. Landscape Development Intensity Index. Environmental Monitoring and Assessment, 101:289-309.
Vogt, P., Riitters, K.H., Estreguil, C., Kozak, J., Wade, T.G. and Wickham, J.D. (2007). Mapping spatial patterns with morphological image processing. Landscape Ecology 22:171-177.
USEPA, 2004. Metals, pH, and Fecal Coliform TMDLs for the Guyandotte River Watershed, West Virginia. March 2004. Final Report, U.S. Environmental Protection Agency, Region 3. Philadelphia, PA.