Pennsylvania National Wetlands Inventory ‐ Landscape Analysis
Summary
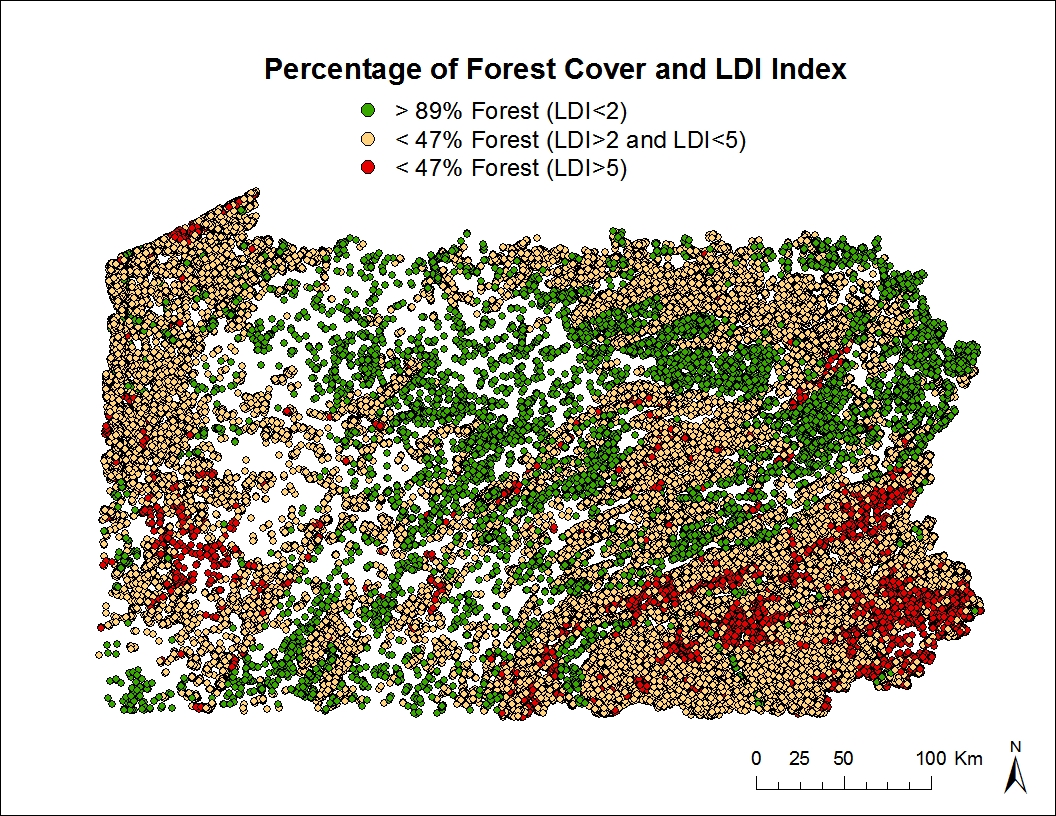
A Level 1 Landscape Assessment using spatial analysis was conducted to characterize all mapped wetlands from the National Wetland Inventory (NWI) within the Commonwealth of Pennsylvania, USA. Wetland sites, comprising more than 168,000 polygons, were defined as 1-km radius landscape circles around the center point of each wetland polygon. Landscape composition was summarized by extracting information of a set of patches of the same type (i.e., a NLCD land use class) within each circle. The following NLCD land use classes were studied: (1) water, (2) developed, open space, (3) developed, low intensity, (4) developed, medium intensity, (5) developed, high intensity, (6) barren, rock/clay/sand, (7) forest, (8) shrub, scrub, (9) pasture, hay, (10) cultivated crops, and (11) wetlands. In addition, four indicators of human activity -Total Core Area Index, Road Density, Landscape Development Intensity Index, and Impervious Surface- were quantified by integrating land cover and road network information. An example of the spatial distribution of wetland sites according to percentage of forest cover (highest and lowest values) and LDI index are shown in the figure below,
Description
Overview: Input data used in the analysis:
1. National Wetland Inventory (2014, 1:24,000), US Fish and Wildlife Service, National Wetlands Inventory (FWS/NWI).
2. A derived Land Use/Land Cover dataset (2011, 30-meter resolution), Multi-resolution LandCover Consortium,
National Land Cover Database.
3. TIGER/Lines Shapefiles (2009, United States Census Bureau)
Outputs: Attributes included in the datasets:
- NWI original attributes
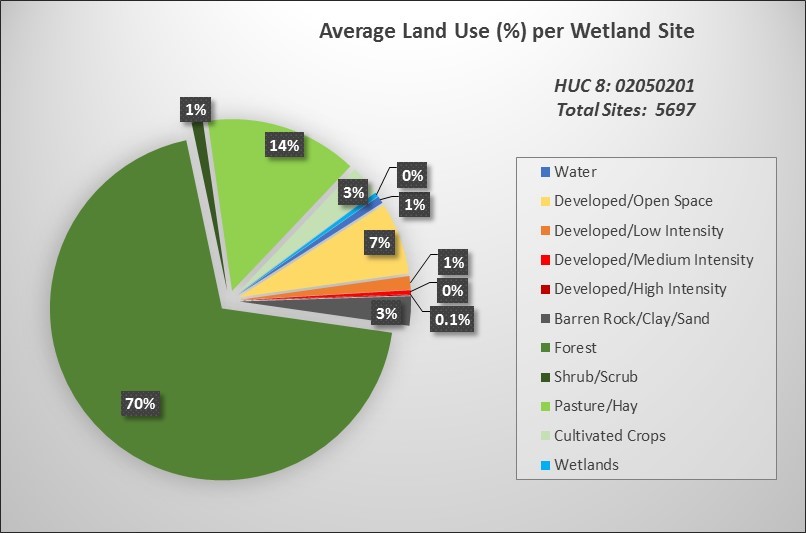
- LU/LC classes (m2,%): water, developed open space, developed low intensity, developed medium intensity, developed, high intensity, barren rock/clay/sand, forest, shrub/scrub, pasture/hay, cultivated crops and wetlands
- Landscape Development Intensity Index (LDI)
- Road Density (km/km2)
- Impervious Surface (%)
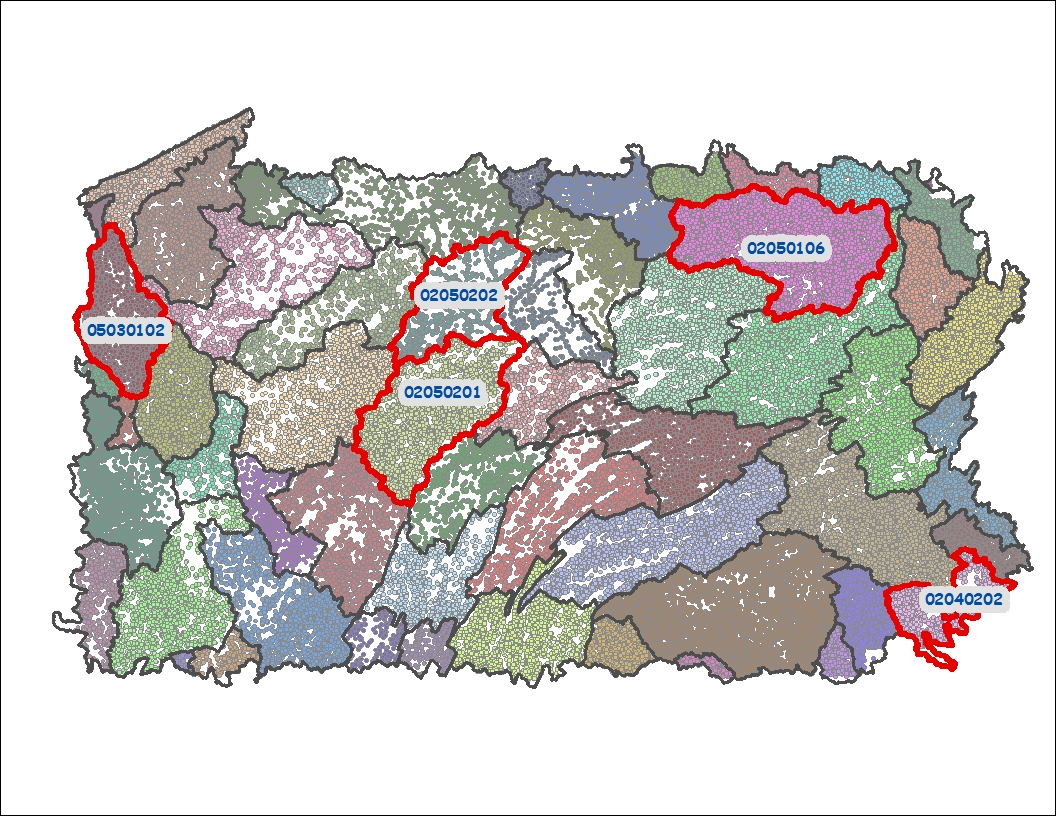
Results can be viewed via the application tab and summarized by watershed according to the 8-digit Hydrologic Unit Code (HUC-8).
Credits
Riparia Center Department of Geography. Pennsylvania State University.
[Corina Fernandez cxf31@psu.edu and Robert P. Brooks rpb2@psu.edu]
Penn State Data Commons Pennsylvania State University.
[James Spayd jfs126@psu.edu ]
Download
Download this datset from the Pennsylvania Spatial Data Clearinghouse (PASDA)